Rocky 1.41
FREEWARE
by Alex VE3NEA

SDR software for SoftRock40
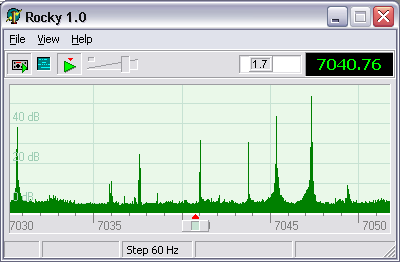
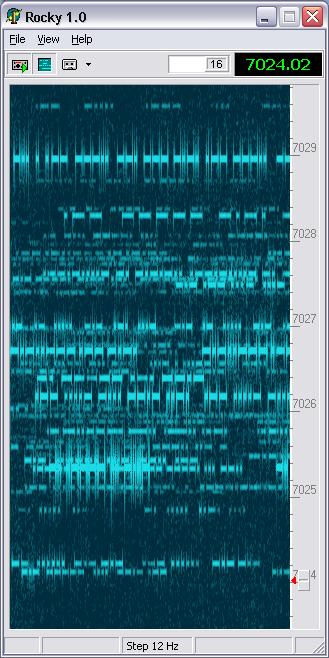
Rocky: main window
System Requirements
RF Hardware: SoftRock40.
The software is pertty useless without the front-end hardware.
Operating system: Windows ME, Windows 2000, or Windows XP.
Rocky may or may not work on Win98SE. It does NOT
work on Win95 and Win98GE.
CPU: P-4 1GHz or higher
is recommended. I tested the program on a P4 3GHz system and on Athlon 600 MHz.
It worked on both, but the CPU load was about 40% on Athlon at the 48 KHz
sampling rate. On the Pentium, the CPU load was 7% at 48 KHz and 10% at 96 KHz.
RAM: 256 Mb.
Rocky requires about 7 Mb of memory. Add another 200 Mb or so for the operating system ;-)
Sound Card: Delta-44
is what I currently use. My on-board SoundMAX also works with
Rocky, but it does not support the 96 KHz sampling rate and generates a lot more noise than Delta.
Quick Start
- Download the Rocky setup package
and run the installation.
- Start Rocky and click on View / Settings in the menu.
- Select the input and output devices, and specify the sampling rate.
If you have two sound cards, select different cards for input and output. This
will allow Rocky to open the output card at a lower sampling rate and thus
save some CPU cycles.
- Click on the DSP tab and enter the exact frequency of the LO in your SoftRock.
- Click on the Start Radio button.
- Use the Windows volume control to set the
desired volume. You have to do this only once, the AGC will take care of the rest.
- Read the section below to learn the basic commands.
Commands
Tune
- Right/Left and Up/Down arrow keys - change the operating
frequency incrementally;
- Rotate the mouse wheel - same as above;
- Drag the spectrum/waterfall display to quickly scan the band;
- Ctrl-Click in the spectrum or waterfall display to tune at the
frequency under the mouse cursor.
Snap
- Click on or near the signal in the spectrum or waterfall display to
precisely tune at the signal;
- Ctrl-Right/Ctrl-Left and Ctrl-Up/Ctrl-Down - jump to the
next/previous signal.
Pan and Zoom
- Drag the frequency scale to pan the display without changing the
operating frequency;
- Drag the Zoom slider to zoom in and out;
- Drag the corner of the window to resize the display.
Change parameters
- PgUp/PgDn - change the tuning step between 12 Hz, 60 Hz, and 300 Hz;
- Home/End or drag the filter box - change the filter bandwidth.
Version history
V.1.4
-
Waterfall display enhancements: key-click filter and super resolution mode.
V.1.3
-
S-meter added. To calibrate the S-meter, tune at a signal
of known strength, then Ctrl-drag the marker on the meter to the place
where it should be.
V.1.2
-
SSB mode implemented. The upper and lower cutoff frequencies of the SSB filter
are independently adjustable.
V.1.1
-
Multi-band support. The drop-down button to the right of the frequency
display allows you to select one of the pre-defined bands. For each band,
the LO frequency and I/Q balance info are stored. Run the program once, then
open Rocky.ini in a text editor and add/delete/edit the band definitions if
necessary.
-
WAV file recording/playback. You can record either the input I/Q signals
or the output audio signal. The I/Q recording can be played back in Rocky.
The recordings of the output signal can be played in MS Multimedia Player.
Please enter your name, callsign and QTH in the Settings dialog. Rocky will
put these data in the comments section of your wav recordings so that other
users will see at a glance when and where the recording was made, who made
it, and what the LO frequency was. When playing an I/Q wave recording, you
can view this info by moving your mouse cursor over the playback progress
bar.
Implementation
Tools and components
Rocky was written in Delphi 5 Pro.
The development cycle was pretty short since I used a lot of code
from my weak signal decoder project. I have been working on that project
for the last 5 years, and now it is very close to completion - but I am so tired
of it that I am starting smaller projects, like
MorseRunner
and Rocky, to have an excuse for not working on the decoder ;-)
Audio I/O
Rocky talks directly to the WDM driver of the sound card. This ensures the
lowest possible latency, eliminates a number of problems associated with the
Windows mixer, and allows easy audio streaming between two souncards. However,
the WDM-based approach has some disadvantages, too: 1) the program does
not work on the old versions of Windows;
2) the sound card can be opened only at the sampling rates directly supported
by the driver, since the program cannot take advantage of sampling
rate conversion in K-Mixer.
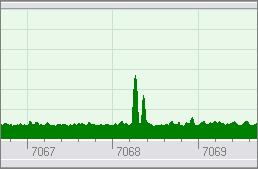
Spectrum Display
The polyphase FFT algorithm is used to calculate the displayed spectrum.
The screenshots below
show the difference between the standard FFT and polyphase FFT: the latter has
much higher resolution but does not introduce extra spectral leakage.
Standard FFT
|
Polyphase FFT
|
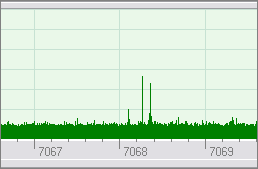
Non-linear filtering is applied to the power spectrum before
it is displayed. This improves the signal-to-noise ratio and makes weak signals
clearly visible in the noise. The filter is always turned on in the program, but I
temporarily disabled it in the code to take the screenshot presented below.
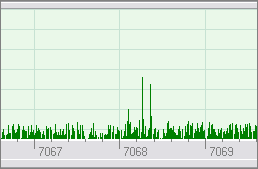
Filter disabled
|
Filter enabled
|
The filter is just a 1-st order lowpass IIR filter:
FilteredSpectrum[i] := FilteredSpectrum[i] * (1-Gain) + NewSpectrum[i] * Gain;
- except that the gain is a non-linear function of the amplitude:
Gain := (1 - Exp(-(0.2 * NewSpectrum[i])));
Due to this non-linearity, the time constant of the filter is high for
the noise but close to zero for the strong signals.
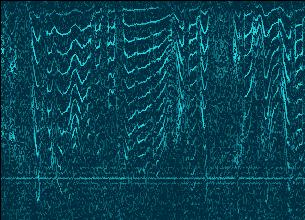
Waterfall Display
While the spectrum display has high resolution in frequency, the waterfall
display is designed to have high resolution in time, so that CW signals
can be copied visually at the speeds up to 40 WPM. How many
callsigns can you read on the screenshot below?
A pileup on the K7C frequency
Two optional filters are available in the waterfall display mode. The filters
can be enabled and disabled using the drop-down menu of the Waterfall Display button.
Key-click filter removes CW key clicks.
It is implemented as spectral subtraction: the estimate of the power density of
the key clicks is subtracted from the power spectrum of the signal. The filter
also has some de-noising effect.
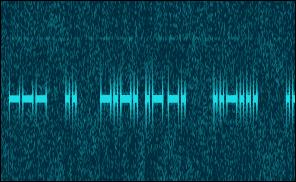
Key-click filter disabled
|
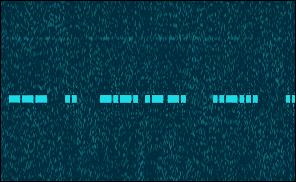
Key-click filter enabled
|
Super Resolution filter is based on the transform
known as time-frequency surface re-parameterization. The method is described in detail in this
publication.
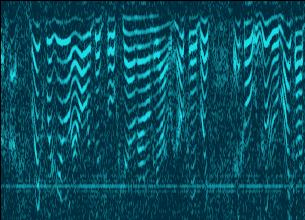
Standard resolution
|
Super resolution
|
I/Q Balancing
I/Q Balancing in Rocky is fully automatic and does not require any lab
equipment, all you have to do is start the program when the band
is open. Rocky will use all strong stations on the band as signal generators!
The algorithm works as follows.
The power spectrum is scanned for the signals
that are at least 30 dB above the noise.
For each signal, synchronous detection of the image is performed using
the main signal as a reference oscillator. The synchronous detector has very high
sensitivity and can detect the image signal even if it is below the noise.
For the signal in the j-th bin of the spectrum,
the normalized output Z of the detector is calculated as follows:
      Z := ComplexMul(ASpectrum[j], ASpectrum[FftSize-j]);
      Pwr := Sqr(ASpectrum[j].Re) + Sqr(ASpectrum[j].Im) +
             Sqr(ASpectrum[FftSize-j].Re) + Sqr(ASpectrum[FftSize-j].Im);
      Z.Re := Z.Re / Pwr;
      Z.Im := Z.Im / Pwr;
The Z value is complex and contains information about the amplitude and phase of the
image in respect to the main signal.
The program averages Z over the time, calculates the required amplitude and
phase correction as a function of frequency, and fits a polynomial to the correction
coefficients.
The I/Q correction filter is constructed from coefficients
and applied to the input signal in the frequency domain.
Click on View / IQ Balance in the menu to see the plots of the phase
and amplitude errors vs. frequency. They should look like this:
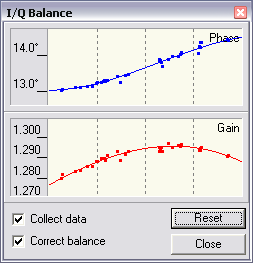
15 min. after start
|
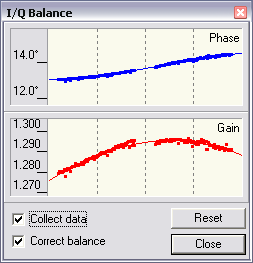
Next day
|
I have an old version of SoftRock40, the one without the mod to the Johnson counter.
The new versions probably have much smaller errors due to better timing
of the LO signal.
Multirate filtering
The main filter is a classical windowed-sinc filter. Since the
bandwidth of the filtered signal never exceeds 3 KHz, it makes sense to do
filtering at a lower sampling rate: this saves a lot of CPU cycles.
The desired segment of the spectrum is mixed down to baseband and
re-sampled at 6 KHz, the filter is applied, and the filtered signal is mixed with
a complex sinusoid to ensure the desired pitch. Mixing, re-sampling and filtering
are performed in the frequency domain. The program tries to open the sound
card for output at the 6 KHz sampling rate. If this fails, it up-samples the signal
to whatever sampling rate is supported by the sound card.
Filter parameters
Bandwidth
The bandwidth of the main filter is adjustable between 20 Hz
and 600 Hz. What bandwidth should you use? In the classical, all-hardware
CW receivers, the 500 Hz bandwidth is the standard: a narrower filter would make
it difficult to find stations on the band and to tune precisely at the signal.
This is not a limitation in a software-defined radio: all stations,
even the weakest ones, are clearly visible on the spectrum and waterfall
displays, and precise tuning at the station can be performed with a single
mouse click. Now you can use very narrow filters with ease.
For a CW signal, the optimal bandwidth in terms of SNR in white noise is
1.5 * WPM - e.g., 45 Hz for a 30 WPM.
Under heavy QRM, even narrower filters should be used: you will have a bit
lower signal-to-noise ratio but much better signal-to-interference ratio.
When you start using narrowband filters in Rocky, you will appreciate the Snap
function. Tuning at a signal manually with a 20-Hz filter is a nightmare!
Shape factor
The shape factor is a ratio of the filter bandwidth at -60dB and -6dB. One might
think that the closer the shape factor to 1 the better. Wrong! Filters with
very small shape factors inevitably ring - not because of poor design, but
due to the Gibbs phenomenon. The only way to eliminate ringing is to increase
the shape factor.
The shape factor can be calculated from the transition bandwidth of the filter
as follows:
ShapeFactor = (TransitionBW + Bandwidth + TransitionBW) / Bandwidth.
Rocky allows you to select one of several pre-defined transition bandwidths,
the choice is presented as a shape factor at the 500 Hz bandwidth. This feature
was added only for experimentation. For everyday operation, use the Auto Select
option - this tells Rocky to maintain the optimal shape factor at any
filter bandwidth.
Exercise. Select the filter shape factor of 1.02, disable AGC,
and set the 500 Hz bandwidth.
Tune at a strong, high-speed CW signal so that its frequency is close
to the filter cutoff frequency. You will hear strong ringing
that starts a fraction of a second before the main signal, and gradually fades out
after the end of the signal.
AGC
The AGC algorithm in Rocky maintains the optimal dynamic range of the output signal.
This is different form the classical AGC systems that care only about
the upper end of the dynamic range. As a result, this AGC has the right gain
both during and in between the strong signals
and allows the operator to hear weak stations between the dots and dashes of the strong ones.
The algorithm estimates the input noise r.m.s. from the spectrum of the unfiltered signal, and computes
the envelope of the total (signal + noise) signal. These two values define the
input dynamic range. AGC maps this range to the desired
output dynamic range with an exponential function:
Out = MaxOut * (1 - Exp(-In / Beta))
The output signal of the AGC unit is a product of the input signal and the AGC gain
as a function of time. In the frequency domain, this is equivalent to the
convolution of the input spectrum and the spectrum of the gain function.
Therefore, AGC adds sidebands to the spectral peaks of the signal - this effect
is known as intermodulation. Since the sidebands are just copies of the gain spectrum,
intermodulation can be minimized by ensuring that the gain function is as narrowband
as possible. This is acheived by lowpass-filtering the gain.
The gain filter consists of a sliding minimum filter followed by the Blackman FIR filter.
The length of both filters is the same, this ensures that the filtered gain
does not exceed the instant gain calculated from the mapping function, and thus
clipping never occurs.
S-Meter
The S-meter in Rocky is an attempt to see if SDR software can do
better than just simulate the behavior of a hardware device. An analog
S-meter is usually based on a peak detector with exponential decay. The
S-meter in Rocky works differently: it tracks the envelope of the signal
using the sliding minimum algorithm, and displays the true signal strength
with a 0.3 s resolution in time. As a result, the indicator does not jump at
each dot and dash or voice burst, and changes only when the signal strength
changes.
The variations of instant power under the envelope are shown on the S-meter
with white dots around the marker, each dot is 6 dB or 1 S unit. In the SSB
mode, you can estimate the peak factor of speech by looking at those dots;
for a CW signal the dots show the difference in power between Morse
elements and spaces between them (that is, the true SNR).
Appendix
Examples of signals on the spectrum display
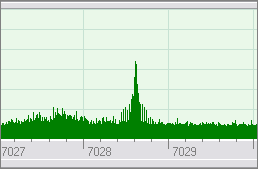
| This is a slow, well-shaped CW signal. Perhaps you could copy it visually
by watching the peak jumping up and down.
|
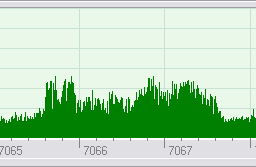
| High speed CW. The structure of the keying sidebands is clearly visible.
|
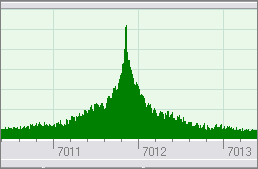
| CW with heavy key clicks.
|
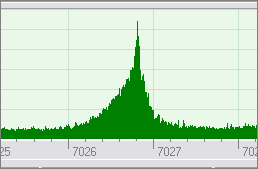
| Chirping CW: the keyclick sidebands are asymmetric.
|
| SSB signals can be easily recognized by their 3 KHz bandwidth.
|
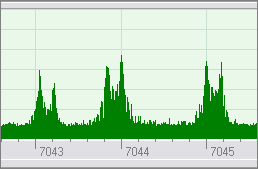
| An RTTY signal has two peaks that are 170 Hz apart. Three signals
are present in this screenshot.
|
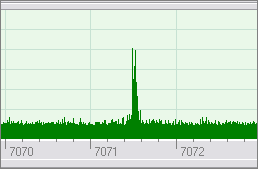
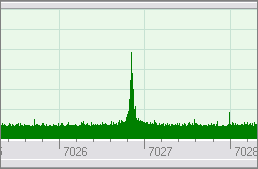
| PSK31 is a phase-shift-keyed signal with the baud rate of 31.5 Hz. Its two
spectral components are 31.5 Hz apart, which is close to the maximum resolution
of the spectral display.
|
More software from VE3NEA
Copyright (C) 2005 Alex Shovkoplyas, VE3NEA